

The aviation activity forecast in a Master Plan documents existing activity levels and projects future activity levels. This includes the change in annual aircraft operations (a takeoff or a landing at an airport), expected passenger enplanements (how many passengers get on a plane at an airport) and the number of based aircraft. The forecasts prepared for this master plan document baseline and forecasted activity levels for the 20-year planning period, through 2040. Forecasts developed for airport master plans and/or federal grants must be approved by the Federal Aviation Administration (FAA). The forecast developed for the Vision 2040 Master Plan was approved by the Federal Aviation Administration (FAA) in June of 2021.
Developing a forecast of aviation activity helps plan for existing and future needs. The forecasting efforts for the Master Plan began in late 2019. The most recent full year of data (2018) was used as the base year.
The Master Plan forecast development was nearing completion right before the Coronavirus pandemic nearly halted air traffic globally. The forecast for the Duluth International Airport (DLH) we re-evaluated in winter 2020/2021 as the ongoing pandemic continued to impact air travel. It was determined that the forecasted five- and ten-year projected activity levels remained realistic projections of likely future activity levels. The forecasts also identify potential scenarios that may occur, such as the addition of air service to a new destination.
For some airports in the US, particularly those with heavy leisure travel, passenger levels are returning to normal levels. The long-term impacts of the pandemic on air travel remain unknown. With the introduction of several effective vaccines in 2020, travel is expected to rebound in the coming years. Air service is forecasted to return to pre-pandemic levels in some markets by 2023. Additionally, Domestic air travel will likely reach pre-pandemic levels before international travel.
Forecast Data Sources
Various data sources are used to develop the aviation activity forecasts. Air travel demand is typically correlated with a region’s demographic and economic characteristics. The economic strength of a region can have a major impact on the aviation activity at an airport. Data used to develop the forecast include local and regional economic and population data, airline ticket data and historical passenger and aircraft operations provided by the FAA. Since DLH has a 24-hour air traffic control tower (ATCT), a count of aircraft operations is available from the FAA. The FAA also publishes annual passenger enplanements (the number of revenue passengers boarding an aircraft); this data helps identify trends.
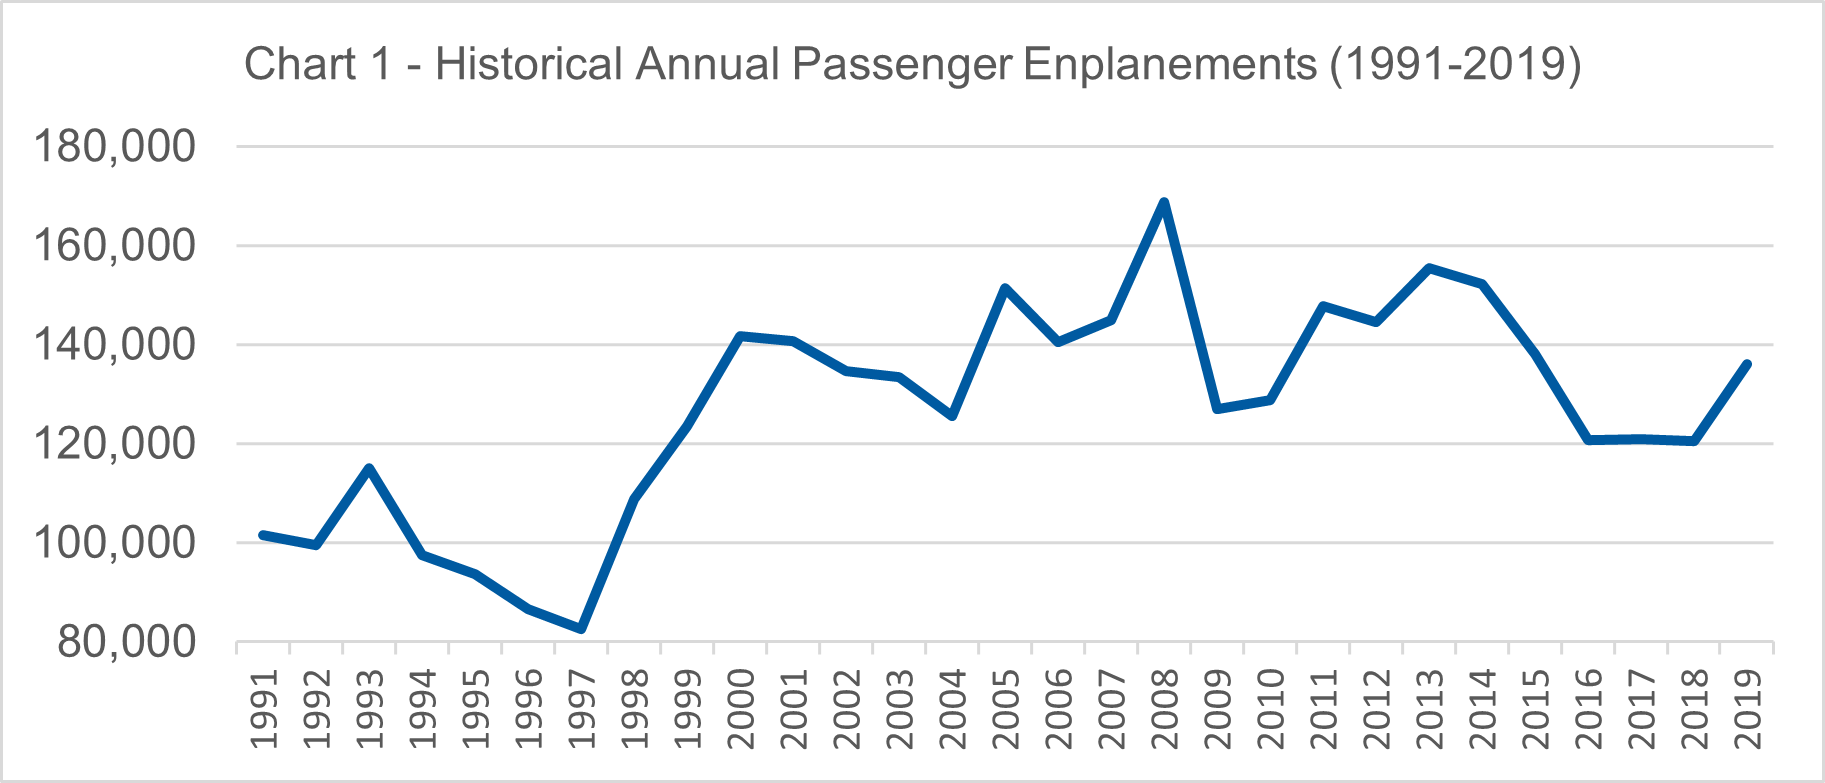
Chart 1 shows annual passenger enplanements since 1991. Passenger enplanement numbers are important when developing facility recommendations for the terminal building and the landside facilities (parking, vehicle access and transportation).
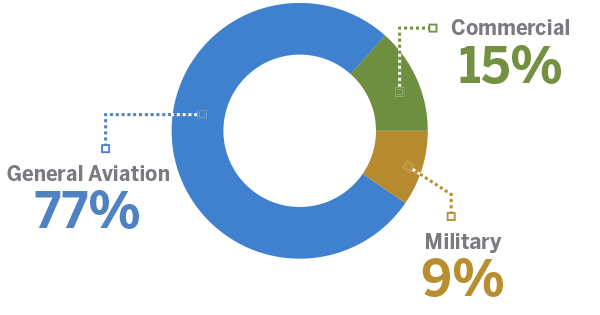
When developing airside recommendations related to the runways, taxiways and aircraft parking aprons, the number of aircraft operations (a takeoff or a landing) by each size of aircraft is important. Chart 2 shows the historical number of operations of general aviation aircraft at DLH. General aviation operations account for roughly 77% of all operations at DLH! The remaining operations consist of commercial operations (15%) and military operations (9%).
Aviation Activity Forecasts
To develop the aviation activity forecasts, historical data, forecasted socioeconomic data, aviation trends and other aviation activity forecasts published by the FAA and the Minnesota DOT Office of Aeronautics were analyzed. Considerations for COVID-19 were incorporated into the forecasts as was the departure of American Airlines from the Duluth market in early 2020. Because the base year was 2018 (2019 was still an estimate when the forecasted effort began), the base year forecast is more conservative than the record year seen in 2019 when American Airlines was flying into DLH.

The aviation activity forecasts included in the Master Plan project passenger enplanements, aircraft operations and based aircraft. Table 1 below shows the activity forecasts through the 20-year planning period.
| Table 1 – Approved Aviation Activity Forecasts | ||
| Year | Airport Forecast | |
| Passenger Enplanements | ||
| Base Yr. | 2018 | 140,485 |
| Base Yr. + 5 Years | 2023 | 145,000 |
| Base Yr. + 10 Years | 2028 | 152,710 |
| Base Yr. + 20 Years | 2038 | 177,720 |
| Total Operations | ||
| Base Yr. | 2018 | 62,600 |
| Base Yr. + 5 Years | 2023 | 67,046 |
| Base Yr. + 10 Years | 2028 | 71,026 |
| Base Yr. + 20 Years | 2038 | 78,739 |
| Base Aircraft | ||
| Base Yr. | 2018 | 68 |
| Base Yr. + 5 Years | 2023 | 72 |
| Base Yr. + 10 Years | 2028 | 76 |
| Base Yr. + 20 Years | 2038 | 85 |
Airport Design and the Critical Aircraft
Why do these forecast numbers matter? They help identify the critical aircraft. The critical aircraft is a representation of a grouping of the most demanding similar sized aircraft that has over 500 operations in a calendar year. The critical aircraft, along with stakeholder input, is a key element to informing the master plan process. It guides how airport facilities should be designed to ensure safety requirements are met. It justifies project funding to funding partners.
 The forecast numbers were analyzed to identify the largest, most demanding, aircraft with more than 500 annual operations. The Airbus A319 was identified as the existing and future critical aircraft. This aircraft is representative of a family of aircraft of similar size and performance.
This information will continue to guide the recommendations of the taxiway network, runways, aircraft parking areas, terminal and landside facilities as the Master Plan is completed.

 | CLICK HERE »
Connect with DLH
Get all the latest DLH news and updates when you follow us on your favorite social network.
Latest News
DLH Construction Update – July 12, 2024
Read More »DLH Construction Update – July 8, 2024
Read More »DLH Construction Update – June 28, 2024
Read More »